Caregiving in the US 2020 Report: Downloads
About this Report
This study presents a portrait of unpaid family caregivers today. The National Alliance for Caregiving (NAC) and AARP are proud to present Caregiving in the U.S. 2020, based on data collected in 2019. Related studies were conducted in 2004, 2009, and 2015 by NAC in collaboration with AARP. This study builds on those prior efforts and replicates the new methodology implemented in 2015, allowing for examination of changes to caregiving since the last data collection effort in 2015.
The core areas we examined in the 2020 study include:
- The prevalence of caregivers in the United States
- Demographic characteristics of caregivers and care recipients
- The caregiver’s situation in terms of the nature of caregiving activities, the intensity and duration of care, the health conditions and living situation of the person to whom care is provided, and other unpaid and paid help provided
- How caregiving affects caregiver stress, strain, and health
- Financial impact on caregivers
- Impacts on and supports provided to working caregivers
- Information needs and resources
- Technology and role of online supports
Report Download

2020 Full Report
Download
2020 Executive Summary
Download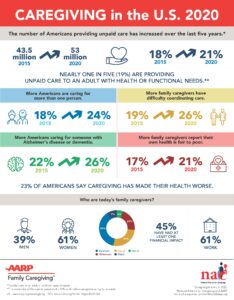
Infographic
Download
Caregivers of Adults 18-49
Download
Caregivers of Adults 50+
Download
African American Caregiver
Download
Asian Caregiver
Download
Feeling Alone Caregiver
Download
Gen X Caregiver
Download
High Intensity Caregiver
Download
Hispanic Caregiver
Download
LGBTQ Caregiver
Download
Millennial Caregiver
Download
No Choice Caregiver
Download
Rural Area Caregiver
Download
Student Caregiver
Download
Appendix A
Download
Appendix B
DownloadThis report is based on nationally representative quantitative online surveys with 1,392 caregivers ages 18 and older. Caregivers of adults are defined as those who provide unpaid care, as described in the following question:
- At any time in the last 12 months, has anyone in your household provided unpaid care to a relative or friend 18 years or older to help them take care of themselves? This may include helping with personal needs or household chores. It might be managing a person’s finances, arranging for outside services, or visiting regularly to see how they are doing. This adult need not live with you.
Additionally, the study asked respondents if they had provided care to a child with special needs in the past year, as described in the following question:
- In the last 12 months, has anyone in your household provided unpaid care to any child under the age of 18 because of a medical, behavioral, or other condition or disability? This kind of unpaid care is more than the normal care required for a child of that age. This could include care for an ongoing medical condition, a serious short-term condition, emotional or behavioral problems, or developmental problems.
Caregiving in the U.S. 2020 utilized Ipsos’ (formerly Gfk) national, probability-based, online KnowledgePanel® as was used in the 2015 wave. For more information about KnowledgePanel®, see appendix B to this report. Online surveys were conducted with a random sample of 1,320 caregivers. To supplement this random sample, 179 additional online surveys were conducted via targeted sampling of racial/ethnic groups, yielding the 1,499 base study, full online surveys with caregivers (by race/ethnicity: 858 non-Hispanic White caregivers, 215 non-Hispanic African American caregivers, 222 Hispanic caregivers, 130 Asian American caregivers,4 and 74 caregivers of another race/ethnicity). In addition to the 1,499 caregivers in the base study, the study included an oversample of 160 older caregivers ages 75 and older. Further, 80 Asian American caregivers were surveyed via telephone (73 landline and 7 cell phone) to bring the total Asian American subsample to 210 caregivers (197 caring for an adult and 13 caring for a child only).
The margin of error for the overall 2020 results is plus or minus approximately 2.5 percentage points at the 95 percent confidence level. This means that 95 times out of 100, a difference of greater than roughly 2.5 percentage points would not have occurred by chance. For subgroups of caregivers, the margin of error is larger.
This report is based on a nationally representative quantitative online survey with 1,392 caregivers ages 18 and older who cared for an adult in the 12 months prior to the time of the survey. The sample sizes shown throughout represent the unweighted number of people who answered each question. All substantive results (means, medians, percentages) have been weighted and rounded.
To signal statistically significant differences between subgroup findings, the report uses an asterisk to highlight any numerical result that is significantly higher than the comparison group, at the 95 percent confidence level. When more than two groups are being compared in columns of a table, a superscript letter next to a numerical result indicates it is significantly higher (at the 95 percent confidence level) than the numerical result in the column designated by that letter.
In the graphics, significant increases or decreases are displayed as the percentage point change from 2015 to 2020 along with a graphic up or down arrow.
All substantive results (means, medians, percentages) have been weighted and rounded. In addition, “don’t know” or “refused” responses are not always presented in figures. For these reasons, data in some figures will not add to 100 percent. The results for multiple response questions may also add to greater than 100 percent.